Currently, I am working on time series forecasting and time series analysis. I’m not going to deep inside the time series analysis though I’m focusing on time series forecasting in my blogs. Before this, I was working on digital image processing, computer vision, machine learning, deep learning, and some other stuff. From the last couple of days, I start working in time series forecasting and I’m really enjoying this domain because in this domain I convert each time series problem into a supervised learning problem which is really what I like. So basically, I decided to post a few blogs of some important concepts. There are a lot of concepts that are very useful in time series forecasting, natural language processing(NLP) and some other domains as well. I can not post blogs on each and every concept though I will post some fewer topics and will provide a list of remaining concepts in my future blogs.
So, let’s get started with white noise. White noise is a crucially important concept in time series forecasting. If the time series is white noise, it can not be predicted because it doesn’t have any specific patterns, it is just a series of random numbers that can’t be predicted. If the series of forecast does not have white noise, it suggests improvements can be made to the predictive model. So very beginning question is what white noise is?
We can say that a time series is a white noise if the variables are independent and equivalently distributed with a mean of zero. This means that all variables have the same division and each value has a zero interaction with all other values in the series. If the variables in the series are drawn from a Gaussian distribution then the series is called Gaussian white noise and If it is drawn from a Binomial distribution this the series is called Binomial white noise. I hope this will clear your ideas that what white noise is. The next question is raised that why does white noise matter to our time series. In time series analysis and forecasting, white noise is mattered a lot due to the predictability and model diagnostics. A gesture that model predictions are not white noise is an indication that further improvements to the model of forecast might be possible.
Now the question is how we can find that is our time-series white noise or not. There are few conditions to have a time series a white noise or not. If the following conditions are satisfied with your time series it clear cut means that your time series is not white noise.
- Is your series have a mean different from zero?
- Is the variance(change) changes over time?
- Are values associate with lag values?
There are some tools available using which you can check if your time series is white noise or not:
- Creating a line plot
- Create an autocorrelation plot
- Calculate statistics summary(mean, change)
Let’s move toward some coding stuff in Python. Now calculate and plot a white noise series.
from random import gauss, seed
from pandas import Series
import matplotlib.pyplot as plt
seed(1)# seed random number generate
series = [gauss(0.0, 1.0) for i in range(500)] # creating white noise list
series_data = Series(series) # converting list to series
print(series_data.describe()) #printing summary stats
From the above snippet of code, you will see the following output:
count 500.000000
mean 0.070046
std 0.975702
min -2.896251
25% -0.580287
50% 0.084831
75% 0.720823
max 2.727850
dtype: float64
Some variance is expected given the small size of the sample. If we had more time-series data, it might be more interesting to split the series in half and calculate and compare the summary statistics for each and every half. We would expect to see a similar mean and std for each sub-series.
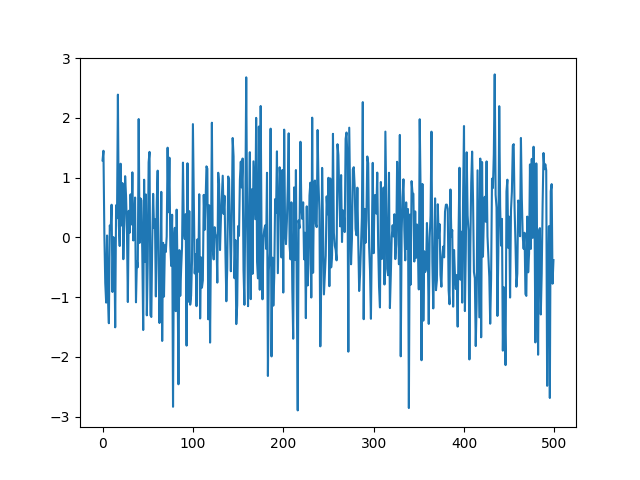
Let’s visualize the above data.
series_data.plot()
plt.show()
Following is the line plot generated from above code snippet:
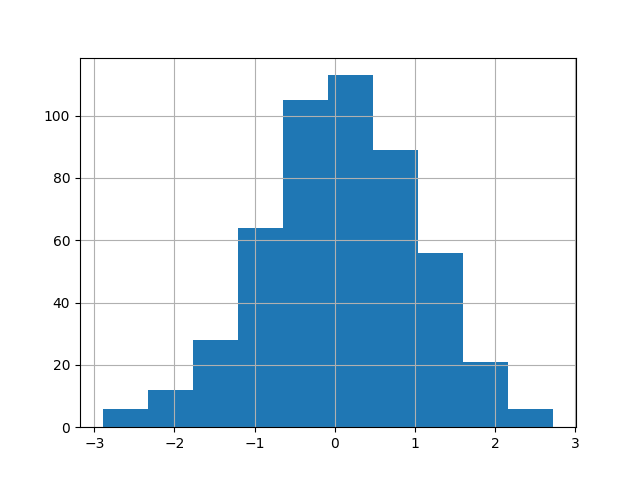
Now plot the histogram of series data.
series_data.hist()
plt.show()
Following is the histogram of data generated from above code snippet:
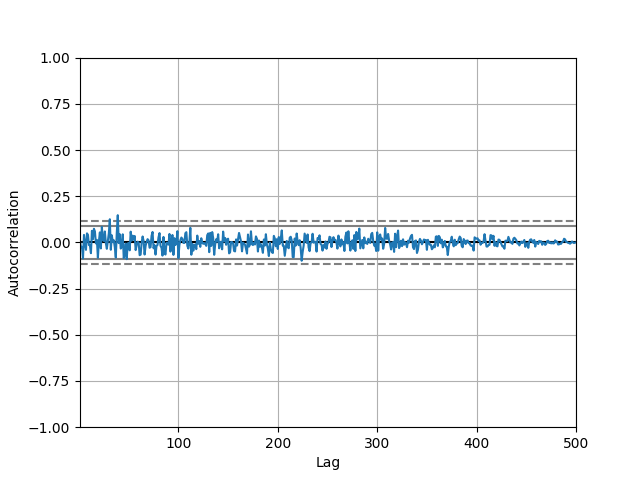
Now visualize the autocorrelation plot of series data. Pandas utility provides an autocorrelation plot to visualize data.
from pandas.plotting import autocorrelation_plot as auto_plt
auto_plt(series_data)
plt.show()
Following is the autocorrelation plot generated from above code snippet.
That’s it for this topic hope you have got some basic idea of what white noise is? how you can identify that either your time series data is white noise or not and how you can calculate it.(Thanks)

One thought on “A gentle intro to White Noise”